Содержание
Summary
Summary contains overall information about the project: dynamics by keywords, Average and Median position, Visibility and keywords distribution by TOPs. Use Summary to quickly evaluate the results of a website's SEO promotion and its dynamics.
The data in Summary is displayed for the last check selected in Calendar, and dynamics is calculated by the last checks of the period. For example, if 30 checks are selected in Calendar, dynamics in Summary will be counted between the first and the last check in the rankings table. To see the trend between the last two checks, select them in Calendar.
UI Map
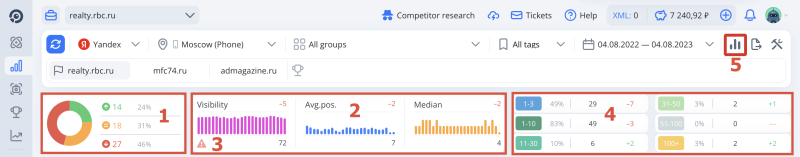
- Dynamics and filter by rank volatility.
- Average and Median position, Visibility and their charts.
- Alert if Visibility is calculated incorrectly.
- Distribution by Tops (percentage of keywords, their quantity, and dynamics of each Top).
- Hide/show charts.
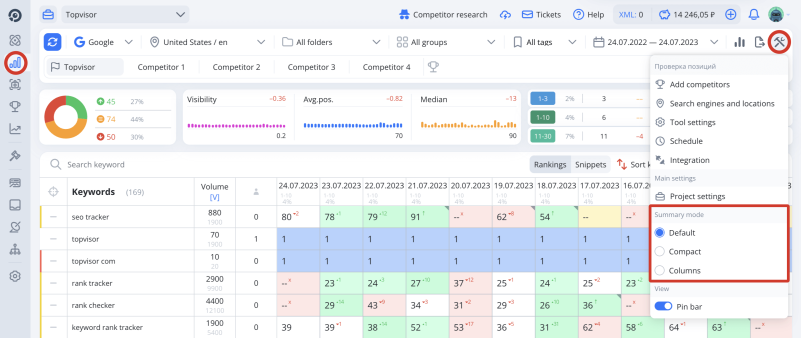
How to change Summary mode
- Go toRank Tracker.
- Clickon the toolbar.
- Select the desired mode of Summary in the drop‑down list.
Dynamics
Dynamics shows for how many keywords a website's ranks have improved, dropped, or haven't changed. Click a segment to filter keywords. To hide keywords which ranks changed slightly, hover over the dynamics and enter the desired value.
How to filter keywords by changed ranks →
Average & Median Position and Visibility
How charts work
Charts show trends in Average & Median Position or Visibility over a large period of time. Unlike the charts below, they show results for all three metrics at once, and can display more checks than selected in Calendar. The higher screen resolution, the more data is displayed in the charts. Hover over a bar to see the exact value of the metric.
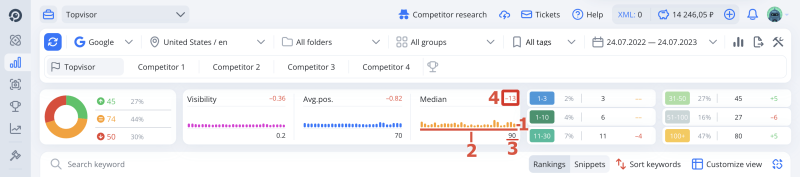
- The last check within the period selected in Calendar. Older checks go from right to left.
- Checks selected in Calendar. Older checks are shown in pale color.
- Metric value for the last check selected in Calendar.
- Metrics dynamics compared to the last check selected in Calendar.
The lower Average or Median position is, the better (because the best position is the first one). Visibility, on the contrary, should aim for a higher value, because the maximum possible Visibility is 100%. Therefore, for example, when Average position was 20 and became 19, green +1 dynamics is displayed, although at first glance Average dropped.
Average position
The average position is an arithmetic mean, that is, the sum of rankings divided by the number of keywords. When calculating the Average, we take into account only the keywords that were checked. If a website wasn't found in Top by keyword, we take the depth of parsing to calculate the Average.
What is the depth of parsing →
Median position
Median position is the middle of the sorted row of positions. Only keywords that were checked are taken into account to calculate Median position.
What is the difference between Average and Median position?
Visibility
Visibility is the percentage of impressions a website may get for keywords added in the project.
How Visibility is calculated →
Keywords distribution by Tops
Distribution by Tops shows how many keywords of a website rank in each Top: Top‑10, Top‑30 etc. Dynamics shows how the number of keywords in Top has changed. Click a segment to filter keywords. By default, the first Top segment is Top–3, but you can change it in the Account Settings (search for Additional Top segment).
How to select multiple segments in Dynamics and Tops Distribution
Select one of the segments, press Ctrl/Cmd and select additional segments to make a multi‑segment filter. You can filter keywords by several segments at once in the sections with Dynamics and Top Distribution. You can find, for example, all keywords for which a website is in Top‑30 and has improved ranks by more than 5 positions.
Press Ctrl/Cmd and select a segment you want to exclude. All other segments would remain active. You can exclude multiple segments by selecting them with Ctrl/Cmd pressed.
I added up the percentages in all segments in Distribution by TOPs and I got over 100%. Why?
Percentage of keywords in Top in the rankings table
You can see the percentage of keywords in Top not only in Summary, but also in the table with rankings. By default, Top‑10 is selected. Click the percentage of keywords to change it.
